Asynchronous Analysis of Windows KPRCBs for Detection of Unsigned Kernel Shellcode Execution

Introduction
What This Post Covers
In this article, we’ll explore:
- How to analyze KPRCBs to monitor currently executing threads across all CPUs and check for potential inconsistencies.
- The tradeoffs of using NMIs, IPIs, and APCs over KPRCB inspection as asynchronous inspection mechanisms.
- A comparison of these techniques in terms of reliability, performance, and evasion resistance.
- How it relates to anti-cheats.
The goal is to provide a practical framework for engineers who need to reason about what processors are doing at runtime and ensure that all kernel instructions can be traced back to trusted, signed system images.
What is “Unsigned Kernel Shellcode”?
In recent years, it’s become a requirement that all kernel mode executable binaries (such as .sys files) be signed by Microsoft themselves in order to be loaded onto systems using standard methods. Kernel mode driver developers can submit their driver binaries using the appropriate developer center portal at which point Microsoft will perform multiple (mostly automated) reviews to help negate the possibilities of developers publishing vulnerable code, thus, helping to secure the Windows Kernel. Once a driver has been found to meet the requirements of Microsoft, it’s subsequently able to be loaded and executed by end users.
However, it is still possible for unsigned binaries to be executed at kernel through any method that allows unchecked access to allocate and write arbitrary instructions to the kernel address space (PML4E >= 256). Typically, malicious actors will make use of a valid and signed driver that has a vulnerability to write hooks into non-patchguard protected system routines, execute said hooks and gain full control of the kernel, including the ability to allocate further executable memory, write instructions of unsigned binaries (often malicious payloads) to the kernel and then setup a means for execution. This process is typically referred to as “Manual Mapping and Executing Unsigned Kernel Shellcode”.
Windows has introduced a feature called “Core Isolation” (A.K.A HVCI) that isolates the windows kernel using virtualization technologies which subsequently significantly raises the bar to executing unsigned shellcode.
Why Monitor CPU Execution?
Most anti-cheat systems only run while the game is running (EAC, BE, etc.). While this limitation is favorable by the standards of most gamers for privacy concerns, it really limits the anti-cheats capability to secure the system. Prior to cheaters launching the game, they can freely load a vulnerable driver and use it to manual map executable shellcode to the kernel address space. The shellcode usually consists of a method to read/write to an anti-cheat protected process from a kernel context.
By monitoring CPU execution, we can potentially identify the location of unsigned instructions and submit said instructions for analysis to determine if they’re docile or part of a malicious package.
Enter the KPRCB
Every processor in Windows maintains its own Kernel Processor Control Block (KPRCB). This internal structure holds valuable state information about what ETHREAD that specific CPU core is currently executing as well as information regarding the current processor state. Performing quick analysis on these datapoints can quickly tell us if there are possibly abnormalities present.

A Quick Primer on KPRCBs
What Is a KPRCB?
The Kernel Processor Control Block (KPRCB) is a per-processor structure that Windows maintains to track the state of each logical CPU. Every core has its own KPRCB, which the kernel uses for scheduling, interrupt delivery, and tracking the currently running thread.
When we want to know what a processor is doing right now, the KPRCB is the natural entry point for inspection.
Key Fields That Matter
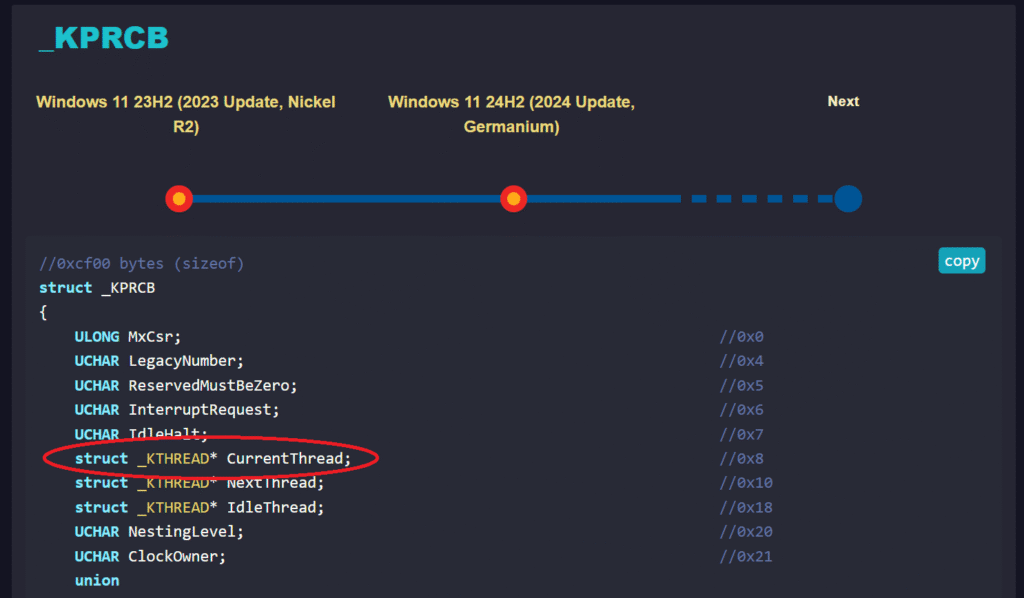
The KPRCB is a big structure, but only a handful of fields are especially useful when we’re trying to detect hidden execution:
- Current Thread / Next Thread – These fields expose the thread currently executing on the CPU, as well as the one scheduled to run next.
- Processor State (
KPROCESSOR_STATE) – Contains the saved register state (general-purpose registers, stack pointers, and RIP) from the last interrupt or context switch.
Tip: You can view the PRCB using windbg like so:
!prcb [Processor]

kd> !prcb
PRCB for Processor 0 at e0000000818ba000:
Threads--  Current e0000000818bbe10 Next 0000000000000000 Idle e0000000818bbe10
Number 0 SetMember 00000001
Interrupt Count -- 0000b81f
Times -- Dpc    00000028 Interrupt 000003ff
Kernel 00005ef4 User 00000385 Why is knowing a CPU’s Current Thread so valuable?
Knowing the currently executing thread is valuable due to the fact that many actors executing unsigned kernel-mode instructions do so with system threads and then try to hide their threads from normal enumeration paths by:
A) Unlinking their threads from the PspCidTable, which is where the kernel normally tracks active threads and processes. See the below pseudocode for nt!PsLookupThreadByThreadId which is the typical method of kernel mode drivers for referencing a thread.
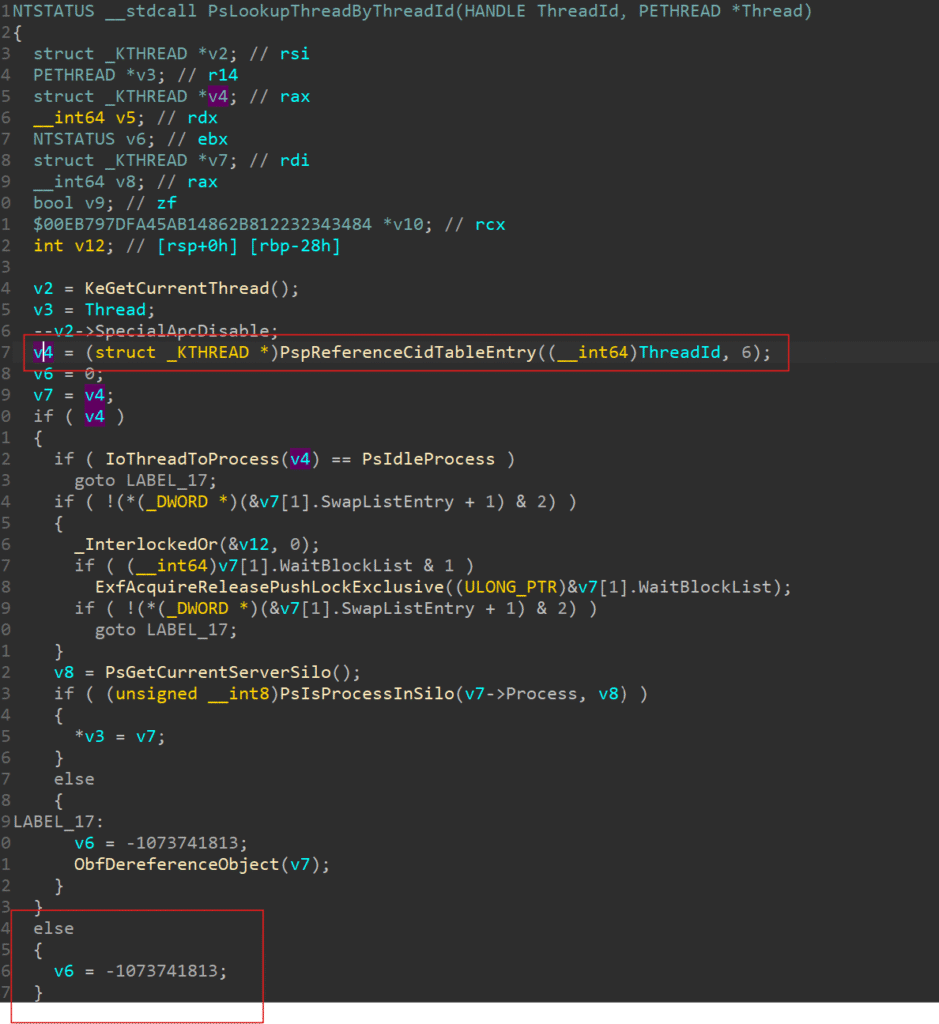

As shown, invoking PsLookupThreadByThreadId will invoke PspReferenceCidTableEntry and if a value isn’t found, the function will fail with STATUS_INVALID_CID and not yield a handle to the potentially malicious thread.
B) Unlinking their system thread from the kernel process’s EPROCESS→ThreadListHead, so they won’t appear when tools walk the standard linked lists of system-owned threads.
Once hidden from these structures, a thread won’t show up in many process managers, forensic dumps, or EDR thread enumerations.
HOWEVER, Even if a malicious actor unlinks its thread, if that thread is actively executing, the KPRCB still has to know about it, because the processor literally can’t schedule work without those pointers.
That makes KPRCB analysis uniquely powerful — it bypasses standard user-mode and kernel-mode thread lists entirely, and instead shows what the CPU is truly running.
How can KPRCBs be monitored?
It’s actually relatively easy from a kernel mode context to analyze the KPRCBs. Consider the below pseudocode.
typedef struct _KPRCB* PKPRCB;

/// <summary>
/// Given a active core index, fetch the currently executing thread.
/// </summary>
/// <param name="idx">Which core # do we want to fetch the currently executing thread for?</param>
/// <returns>ETHREAD running on the core or NULL</returns>
__forceinline PETHREAD GetThreadExecutingOnCore(USHORT idx) {
    //Get a pointer to this core's KPRCB.
    PKPRCB pkprcb = KeQueryPrcbAddress(idx);
    if (!pkprcb)
        return NULL;

    //Get KPRCB->CurrentThread
    return *(PETHREAD*)((uintptr_t)pkprcb + 0x8);
}

/// <summary>
/// Is the specified thread in the PspCidTable?
/// </summary>
/// <param name="thread">Thread to check for existence in the PspCidTable</param>
/// <returns>If the thread can be found in the PspCidTable</returns>
bool IsPresentInPspCidTable(PETHREAD thread){
    //Get the thread's ID.
    HANDLE id = PsGetThreadId(thread);

    //Look it up.
    PETHREAD pThread = NULL;
    NTSTATUS status = PsLookupThreadByThreadId((HANDLE)id, &pThread);

    //Was it a match?
    bool match = pThread == thread;

    //Handle a thread being found successfully.
    if(NT_SUCCESS(status) && pThread)
      ObDereferenceObject(pThread);

    return match && status != STATUS_INVALID_CID;
}

/// <summary>
/// Is the specified thread in the Kernel's EPROCESS->ThreadListHead linked list?
/// </summary>
/// <param name="thread">Thread to check for existence in the linked list.</param>
/// <returns>If the thread can be found in the linked list.</returns>
bool IsPresentInKernelProcessThreadList(PETHREAD thread){
    //Get EPROCESS->ThreadListHead for the system process.
    auto threadListEntry = (PLIST_ENTRY)((ULONG_PTR)PsInitialSystemProcess + THREAD_LIST_ENTRY_OFFSET);

    //Create an enumerator.
    auto listEntry = threadListEntry;

    //Walk the linked list.
    while ((listEntry = listEntry->Flink) != threadListEntry)
    {
        //Offset the pointer to the base address of the ETHREAD object.
        auto entry = CONTAINING_RECORD(listEntry, _KTHREAD, ThreadListEntry);

        //Is it found?
        if((PETHREAD)entry == thread)
            return true;
    }

    //Not found.
    return false;
}

/// <summary>
/// Analyze the threads currently executing on all active CPU cores.
/// </summary>
/// <returns></returns>
void AnalayzeKPRCBs(){
    //Get the number of processor cores.
    ULONG processorCount = KeQueryActiveProcessorCountEx(ALL_PROCESSOR_GROUPS);

    //Loop all processor cores.
    for(ULONG i = 0; i < processorCount; i++){
        //Get the currently excuting thread.
        PETHREAD t = GetThreadExecutingOnCore((USHORT)i);
        if(!t)
            continue;
        if(PsIsThreadTerminating(t))
            continue;

        //Has it been unlinked from the PspCidTable?
        if(!IsPresentInPspCidTable(t))
            printf("Thread 0x%llx [%d] (Executing on core %d) is not found in the PspCidTable!", t, PsGetThreadId(t), i);

        //If it's a system thread, can it be found in the kernel EPROCESS->ThreadListHead linked list?
        if(PsIsSystemThread(t) && !IsPresentInKernelProcessThreadList(t))
            printf("Thread 0x%llx [%d] (Executing on core %d) is not found in the Kernel Process's (PID 4) ThreadListHead linked list!", t, PsGetThreadId(t), i);
    }
}Further conclusions can be drawn from analyzing the CurrentThread from the KPRCB via stack-walking it or by inspecting the KPRCB’s KPROCESSOR_STATE.
Comparisons to NMI, IPI, and APC Approaches
- NMIs (Non-Maskable Interrupts)
- Pros: Can immediately break into any CPU, even if it is executing malicious code. Great for “freezing” execution and grabbing a perfect register snapshot.
- Cons: Highly disruptive; frequent NMIs degrade performance and risk destabilizing the system. Malicious code may detect repeated NMIs as suspicious behavior. Malicious code may also may endlessly hold one of many spinlocks the Windows Kernel requires control of to insert and/or trigger NMIs.
- IPIs (Inter-Processor Interrupts)
- Pros: Useful for coordination between cores; can trigger specific work on a target processor.
- Cons: Still involves halting/interrupting normal execution, and sophisticated malware may intercept or abuse the IPI handler path.
- APCs (Asynchronous Procedure Calls)
- Pros: Allow targeted execution in the context of a specific thread, often user-mode. Handy for stack walks and thread analysis.
- Cons: Requires a cooperative thread context; kernel-mode rootkits can suppress or delay APC delivery.
By contrast, KPRCB enumeration doesn’t rely on forcing CPUs to reveal their state at an exact moment. Instead, it uses the information the kernel has already captured at context switch/interrupt boundaries.
Analyzing Inconsistencies
When performing asynchronous KPRCB sweeps, we can compare three perspectives:
- Thread appears in KPRCB but not in
PspCidTable: Likely indicates a deliberately hidden thread. Strong signal of rootkit-style evasion, since unlinking from the global handle table is not something legitimate code does. - Thread IS a system thread and is found executing in a KPRCB->CurrentThread but not in
System (PID 4) → ThreadListHead: Suggests an attempt to conceal the thread from process-based enumeration tools. A system thread that isn’t linked to the kernel process is suspicious, since legitimate kernel workers must still be tracked by the System process object. - Thread appears consistently in all three sources: Normal case — expected alignment between execution state, handle table, and process-linked thread list.
Limitations of Consistency Checks
While powerful, there are a few caveats:
- Race Conditions – It is possible to catch a thread mid-creation or mid-termination where it temporarily appears inconsistent.
- Pool Corruption – If memory structures are corrupted, apparent mismatches may result from general system instability rather than malware.
- False Positives from Debugging/Instrumentation – In some rare cases, specialized instrumentation or custom drivers may manipulate thread linkage for non-malicious purposes.
Thus, defenders should corroborate mismatches with other indicators, such as suspicious RIP values (e.g., executing from non-image-backed memory) or signs of tampering in adjacent kernel structures.
Wrapping Up
Throughout the article we’ve discussed what the KPRCBs are, how they can be useful for detecting anomalies and the possible false positives. What remains is “How do we apply this knowledge to cheats & anti-cheats?”.
The answer is simple, cheaters often take the path that’s most documented and one of the most popular methods to executing a game cheating payload at kernel space is via an unlinked/hidden system thread. With this in mind, we still know that the system must eventually execute their code and when it does, we as an anti-cheat may be monitoring the KPRCBs when it happens and see their attempt at hiding a thread or be able to establish that the instruction pointer is pointing to an unsigned memory region that we can further analyze.
Disclaimer
Portions of this article were written with the assistance of AI tools. All prompt instructions and pseudocode snippets are original.